This is a part 1 of a 2 part discussion and presentation of the energy systems and their place and role in cycling performance and training. Read Part 2.
The Metabolic Process
Exercise metabolism consists of the pathways and energy systems our body’s use to convert the food we eat into the required energy used during exercise. By understanding how the body converts food to energy provides a tenet for understanding how we should train, what and when we should eat, and even exploit strategy for fueling and effort during races.
Energy to power muscle contractions is released when oxygen combines with carbohydrates, fats, and proteins in the cell to produce Adenosine Triphosphate or ATP (triphosphate, as in three phosphates). These processes are termed oxidation reactions (literally “a combination with oxygen”) and are only a few of the many reactions (cell metabolism) within the cell that maintain cell viability. The amount of energy produced in oxidation reactions is limited by either the amount of oxygen available to the cell, or by the supply of fuel (carbohydrates, fats, and protein) to be oxidized.
ATP: The Body’s Energy Currency
ATP is the main energy currency of the cell. It is what allows us to do work, like pushing on the pedals on your bicycle. Energy from ATP is released when it loses a phosphate and becomes adenosine diphosphate (ADP; diphosphate, as in two phosphates). Once ATP is converted to ADP it has a hard time helping with the work in the cells (e.g. muscle fibers) until it is converted back into ATP. There are two main methods in which the cells of the body do this. A phosphate can be put onto an ADP through anaerobic means (without oxygen), through a series of processes collectively known as substrate phosphorylation, or through aerobic means (in the presence of oxygen) by a process called oxidative phosphorylation.
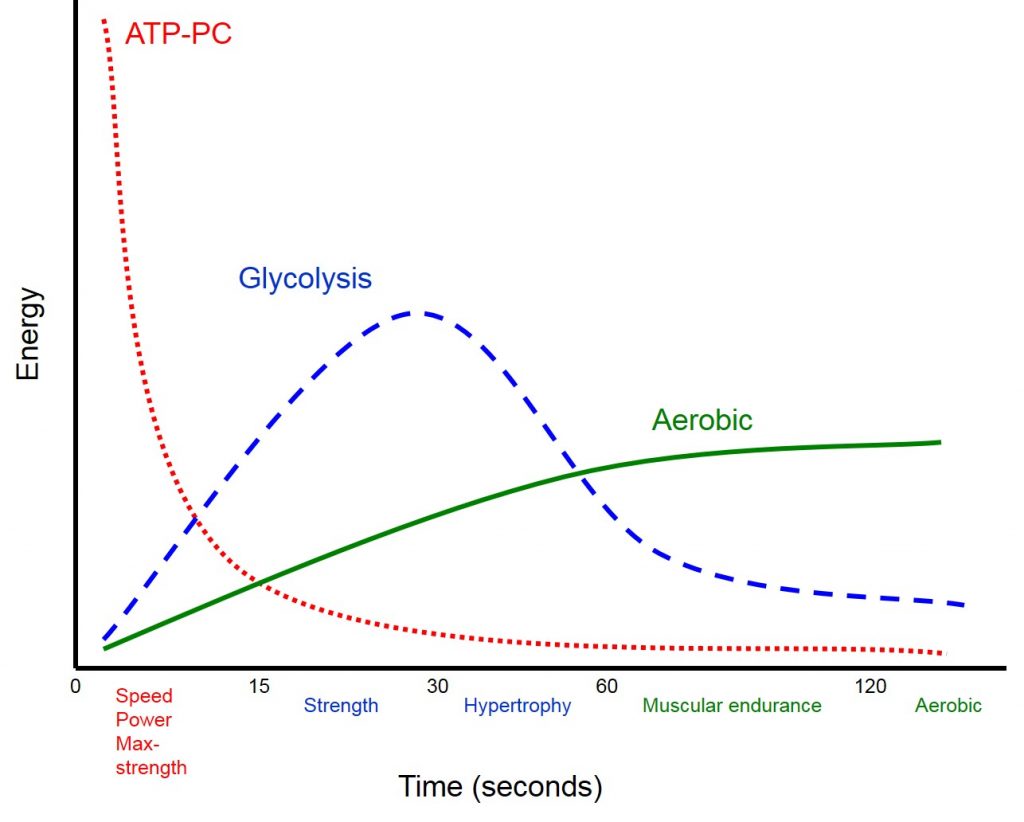
Figure 1: The energy systems utilized over time by the athlete and the emphasised physiological development.
ATP and the Energy Systems
The athlete will utilize their energy systems to access these sources of ATP. The human body has three major systems of energy generation:
- Phosphocreatine (ATP-PCr) System
- Glycolytic or Lactic Acid (anaerobic) System
- Oxidative (aerobic) System
Each of the body’s three bioenergetic systems need to be developed through training for optimized performance.
The adenosine triphosphate Creatine-phosphate (ATP-PCr) system provides energy at a rapid rate for activities lasting 15 seconds or less. The glycolytic, or lactic acid system, provides energy for those activities lasting 15 seconds to 2 minutes. Lastly, the oxidative (aerobic) system provides energy for those activities lasting longer than 2 minutes.
These energy systems drive all of our activity on or off the bike. Understanding them will help you to focus your training and optimise your nutrition. The interplay of the energy systems will help you understand training zones (levels) and how to manipulate activities such as interval sessions to foster improvements that match energy system development to your specific event or discipline.
What is important to remember is that the body draws on all three, regardless of the type of effort, never closing one off completely. The percentage and amount of energy they contribute will simply depend on the duration and intensity of the effort.
For example, a 1-minute all out effort is not completely anaerobic, and it will not completely exhaust your anaerobic work capacity (AWC) (which usually takes around 90 seconds to 150 seconds to fully deplete). In the same way, a 5 minute maximal effort is not going to be dosed out at exactly 100% of VO2max necessarily as many athletes can do as much as 110% of their VO2max for this duration. The crossover point (i.e., aerobic to anaerobic) and exercise duration-intensity relationship is impacted by fitness level and training.
“Regardless of the type of effort, the body never closes off all energy systems completely.”
James Hewitt, speaker, author & performance scientist
Energy Systems and Power Based Training Zones
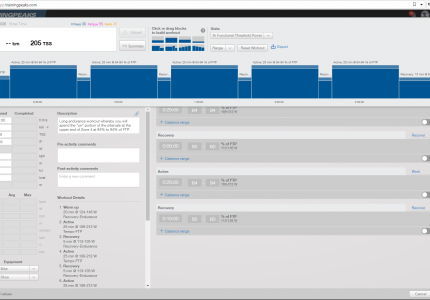
In power based cycling training, the energy systems are reflected in power based cycling training levels or zones. You can read more about these levels, (read more here). Essentially they are a way of categorizing how intense an effort is, which dictates how long the effort will last, and which systems will predominantly supply energy for the effort. These training levels or zones provide context for dosing training sessions, enabling structure in training programs, and understanding the expected training adaptations.
There are a few variations out there, but for cycling with power – Dr. Andy Coggan’s power training levels stand out as the first comprehensive system that was developed by drawing upon fundamental principles of exercise physiology as well as approximately two decades of experience with power-based training in both laboratory and field settings.
In the Coggan classic system there are 7 levels or zones each representing an intensity and time frame and a single or combined energy system. The zones are both descriptive and prescriptive, and it is important to remember that all physiological responses fall on a continuum with one training level or intensity blending into the next which reflects how the energy systems also behave, as described above.
These training levels (zones) have specific relationships to each of the three main energy systems utilized by the human body, these are:
ZONES 1-3 REPRESENT THE AEROBIC SYSTEM:
Zone 1 – <55% of FTP, emphasis Active Recovery, duration 70-80 years
Zone 2 – 56-75% of FTP, emphasis Endurance, duration 2.5 hours to 14 days
Zone 3 – 76-90% of FTP, emphasis Tempo, duration 2.5 to 8 hours
ZONES 4-6 REPRESENT THE LACTIC ACID SYSTEM – MAX AEROBIC/ANAEROBIC:
Zone 4 – 91-105% of FTP, emphasis Lactate Threshold, duration 10-60 minutes
Zone 5 – 106-120% of FTP, emphasis V02 Max, duration 3-8 minutes
Zone 6 – >120% of FTP, emphasis Anaerobic Capacity, duration 30 seconds to 2 minutes
ZONE 7 STANDS OUT ON ITS OWN AND REPRESENTS THE ATP-PCR SYSTEM:
Zone 7 – N/A, emphasis Neuromuscular Power, duration 3-15 seconds
How do each of these systems function within the body with regard to the biochemical process and the activity undertaken by the athlete?
Energy System: Anaerobic – Phosphocreatine (PCr) System – Zone 7 (3 to 15 seconds)
The phase of greatest intensity, and shortest duration, in energy utilization is called the ATP- PCr (Adenosine Triphosphate)- (Phosphocreatine) system. The ATP stored in all cells, particularly muscles, is accessed by the ATP-PCr system and doesn’t require a blood supply and has no by products.
There are not many steps in the chemical reactions that make up the ATP-PCr system. The reactions can take place in the absence of oxygen and phosphocreatine is a relatively high energy molecule. As a result, the ATP-PCr system can provide a lot of energy quickly but only for immediate and short (around 10 -15 seconds) maximum intensity efforts. Think winning sprint!
In a sense, it is free energy because the body stores ATP to make it available for immediate use, however, you can only use it once and it needs recovery time to restore the storage. Once you have depleted your Phosphocreatine stores in a sprint it can take as long as 5 minutes to restore them to their resting levels, ready to sprint again. Making it a high rate – low capacity system.
Energy System: Anaerobic – Lactic Acid System (LA) – Zone 6 (30 sec to 2 minutes)
The next major energy phase is called the Lactic (LA) system. After the 20 seconds of the ATP-PCr system, the body requires another ingredient– muscle glycogen (glucose) to be added to continue.
The LA system breaks down carbohydrate, a fuel in limited supply in the body, to produce medium amounts of power for medium amounts of time. However, the energy is produced without oxygen (anaerobically) using carbohydrate > sugar > glucose > glycogen > ATP.
The body’s stores around 500 grams worth of carbohydrate in the tissues of the liver and muscles in the form of glycogen. This amount of energy would fuel approximately 2000 Kilojoules of mechanical work on the bike, as recorded by a power meter. That could be a 3 to 4 hour ride if all the stores are utilized.
Regardless of how long an effort is, carbohydrate is always initially broken down through a chemical reaction called anaerobic glycolysis. Oxygen is not required for this reaction, and whilst only about 5% (2 ATP molecules) of the energy potential of a glucose molecule can be realised, the energy is liberated quickly, so this energy system is well suited to high intensity efforts greater than 10 seconds to 2 minutes.
Because anaerobic glycolysis can only supply short efforts, it only makes a small dent in the roughly 2000 Kilojoules of stored carbohydrate available. So the time limitation is related to the chemical processes involved in anaerobic metabolism and their interaction with the body, rather than a lack of availability of carbohydrate.
So the time limitation is related to the chemical processes involved in anaerobic metabolism and their interaction with the body, rather than a lack of availability of carbohydrate.
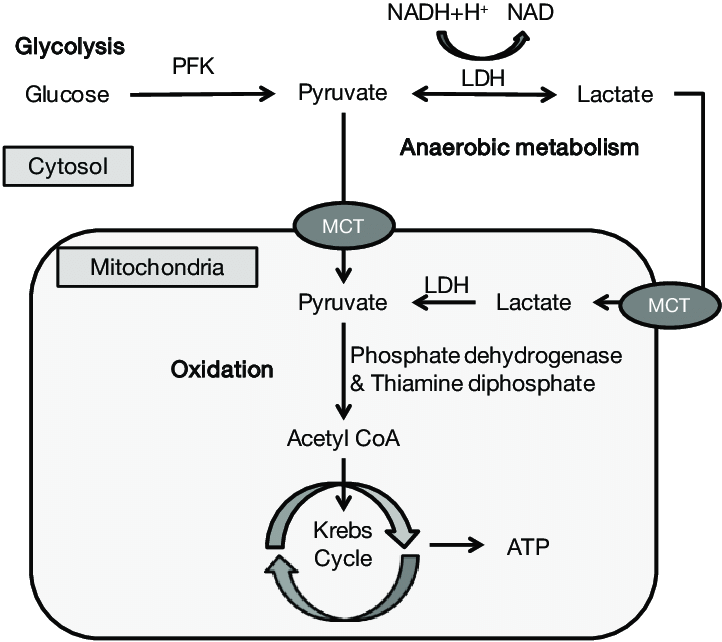
Figure 2: Lactate - a product of anaerobic glycolysis
“. . . the stored energy in your body is broken down into a compound called pyruvate, your body turns pyruvate into lactate to fuel the muscles.”
The principal by-product of anaerobic glycolysis is lactate, which comes from the breakdown of the glucose released from the muscles. Most cyclists have heard of lactate or lactic acid. Lactate is not a waste product but is actually an important part of anaerobic and aerobic metabolism.
During high intensity efforts lactate is produced in greater amounts than can be removed from the body, and contrary to popular belief, fatigue is not simply the result of lactate or lactic acid accumulation – there is a lot of misunderstanding around this molecule. For one, lactate does not cause muscle soreness.
“The technical difference between lactate and lactic acid is chemical. Lactate is lactic acid, missing one proton. To be an acid, a substance must be able to donate a hydrogen ion; when lactic acid donates its proton, it becomes its conjugate base, or lactate. When you’re talking about body’s lactate production and lactate or lactic acid threshold, the difference is largely a matter of semantics. But, the body produces and uses lactate — not lactic acid.”
Andrea Boldt, What is the Difference Between Lactic Acid & Lactate, Livestrong.com
Energy System: Oxidative (Aerobic) System – Zones 1 to 5 (3 min to all day)
The third system is the oxidative phase. In this phase you are using oxygen predominantly to fuel the breakdown of carbohydrates first, free fatty acids second and if the exercise continues long enough – protein. Whereas, the Anaerobic – Phosphocreatine (PCr) and Anaerobic – Lactic Acid (LA) systems are related to extreme and higher intensity work (or power) for time duration’s less than 2 minutes. The aerobic system is more predominant in moderate or low intensity work efforts, and particularly as the exercise duration gets longer. In fact, anything beyond 2 minutes in effort is effectively aerobic.
The aerobic system can draw on your stores of glucose but only for approximately 90 minutes at most. This is why you need to replenish your glucose stores with carbohydrates (CHO) during your riding efforts.
The aerobic system development will also aid the lactic (LA) system. The development of the aerobic system aids in lactate removal so that you can tolerate more lactate. This defines the relationship between the two systems and why a stronger aerobic base will permit greater tolerance for anaerobic and high intensity shorter efforts.
What Does This Mean For Your Training?
No matter if you’re a road racer, gran fondo participant, triathlete, or a mountain bike racer, you use all the body’s energy systems to ride and train. Individually, you have strengths and weaknesses for specific duration’s and intensities. For example, you may have a weak sprint and 1 min anaerobic capacity, but have more than average aerobic endurance power at 30 to 60 min relative to others.
For example, in Figure 3 below, the athlete’s power profile, expressed in w/kg, demonstrates their relatively low power outputs for 5 seconds (neuromuscular), 1 min (anaerobic), but they have moderate to good power output at 5 min (maximal aerobic), at 20 min duration, and at TTE (Time to Exhaustion), reflecting aerobic endurance and FTP power. To improve performance and fitness, whether it’s being a better sprinter, improving time on long climbs, or pushing a steady state 70.3 triathlon bike leg, each energy systems capacity can be improved through training to specifically answer each of these needs.
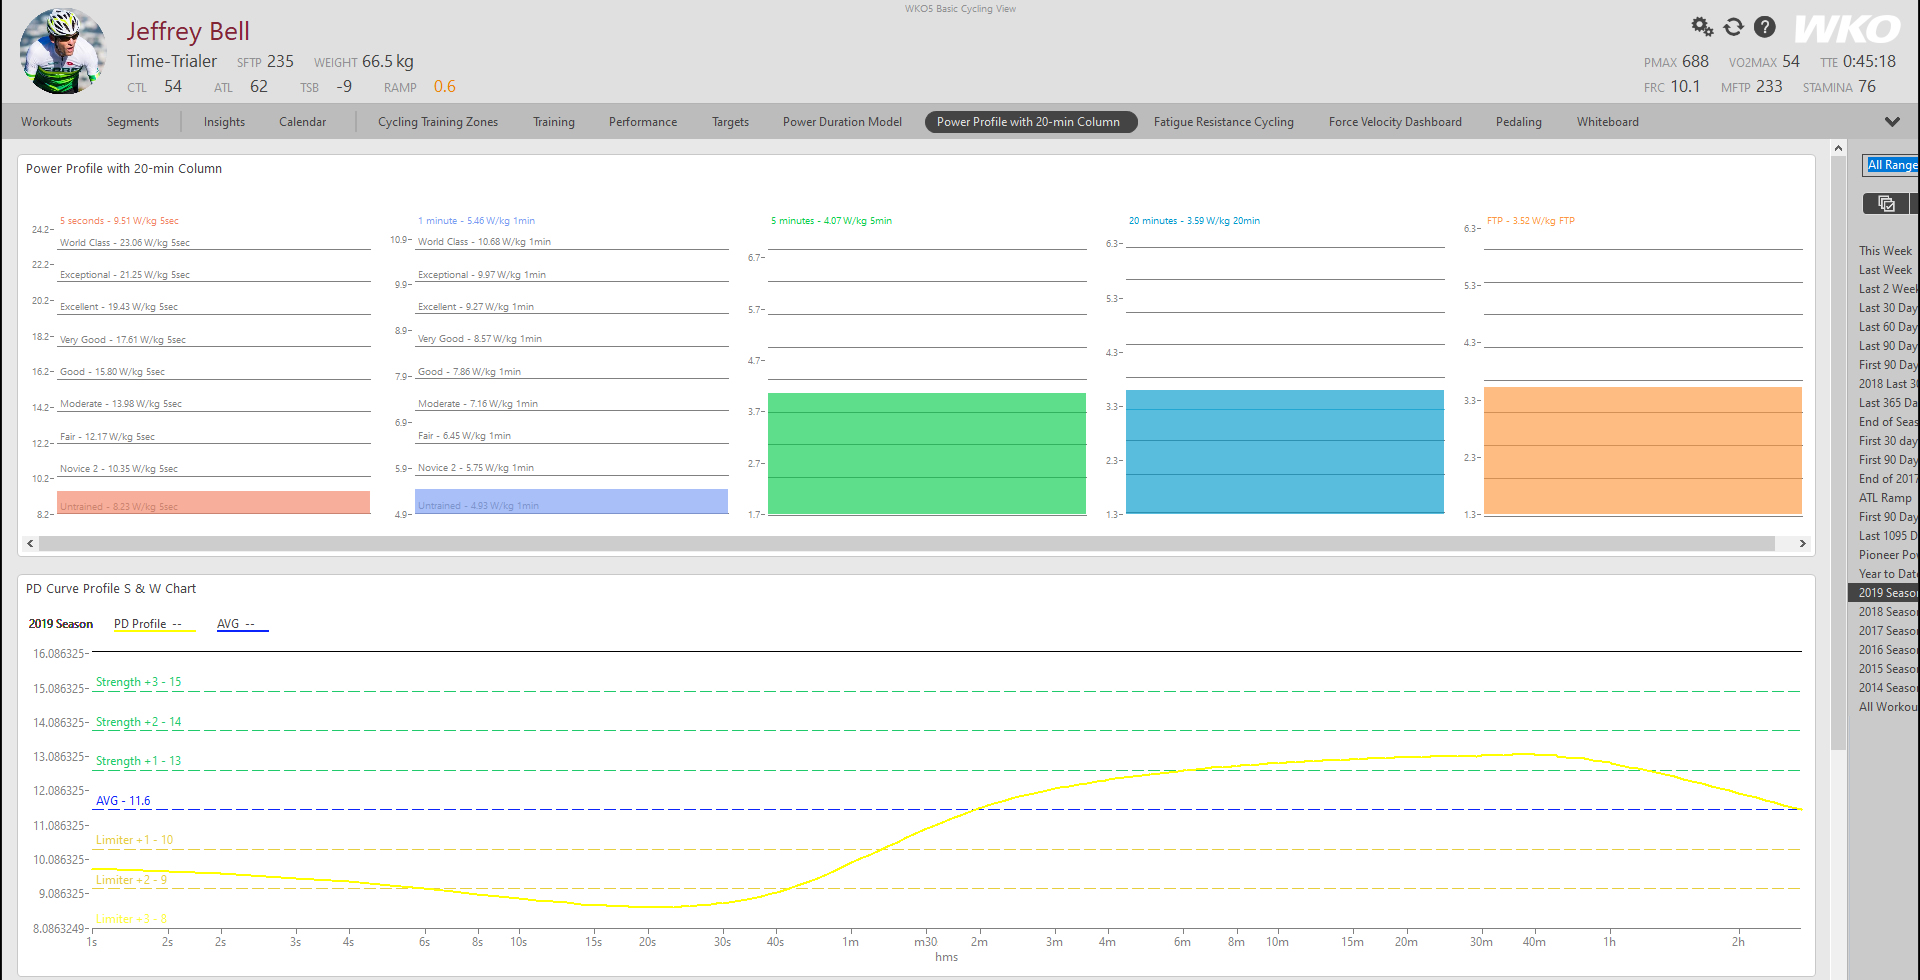
Figure 3: The athlete's power profile expressed in w/kg.
On the bike, all systems are providing a varying portion of the required energy, depending on the intensity and duration of the work being done. As you gather the data from riding with your power meter, and complete enough maximal efforts at various duration’s, the data collected will provide the true structure of your power profile. This power-duration relationship will be described by your mean maximal power curve and modelled power duration curve, one that reflects your current physiological profile.
If you were to do a 120 second maximal effort, the first 10-15 seconds is fueled almost entirely by the PCr system, producing a huge burst of power, but very quickly fatiguing. After around 10 seconds the Phosphocreatine system is completely exhausted and the lactate acid system starts to kick in. By 30 seconds the LA system has fully taken over but rapidly starts to fatigue as lactate acid accumulates. By 40 seconds, the aerobic system has begun to kick in as oxygen has made it to the working muscle and begins to assist with the aerobic contribution to energy production.
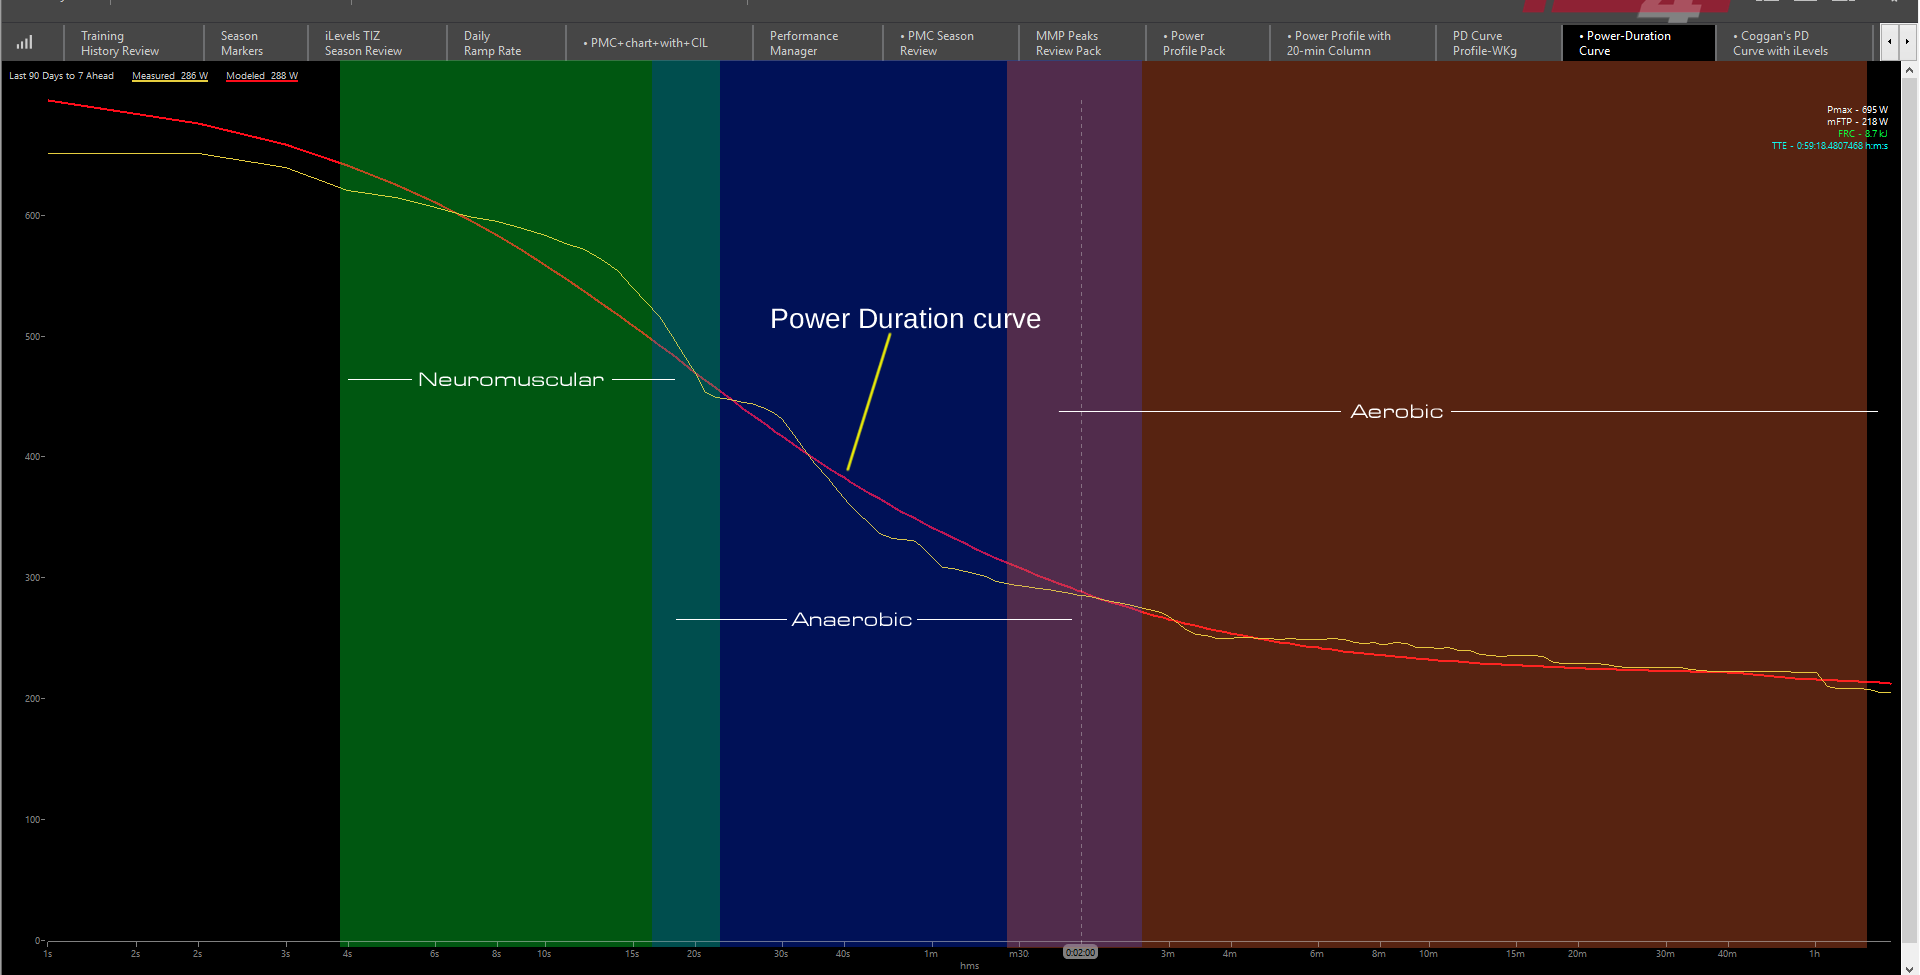
Figure 4: Power duration curve and the relationship of the energy systems that fuel and drive power output over time.
Figure 5, below, illustrates the relationship between anaerobic and aerobic systems and the crossover of one to the other in the energy and power output spectrum. In Figure 5 below, it is clear that the athlete’s 2 minute maximal effort, although classified predominantly as anaerobic, relies upon an increasing aerobic contribution and oxygen for 50 percent or more of the effort duration. Indeed for this athlete aerobic contribution is at 80% for this time duration.
The anaerobic/ aerobic crossover point, which in this example, occurs at 39 seconds, will be influenced by the development of the athlete’s own anaerobic work capacity (AWC). This is a trainable element and is represented by the FRC curve in Figure 5. If the athlete can shift this curve to the right through training, they will have a larger AWC and be able to delay the onset of aerobic support during such efforts.
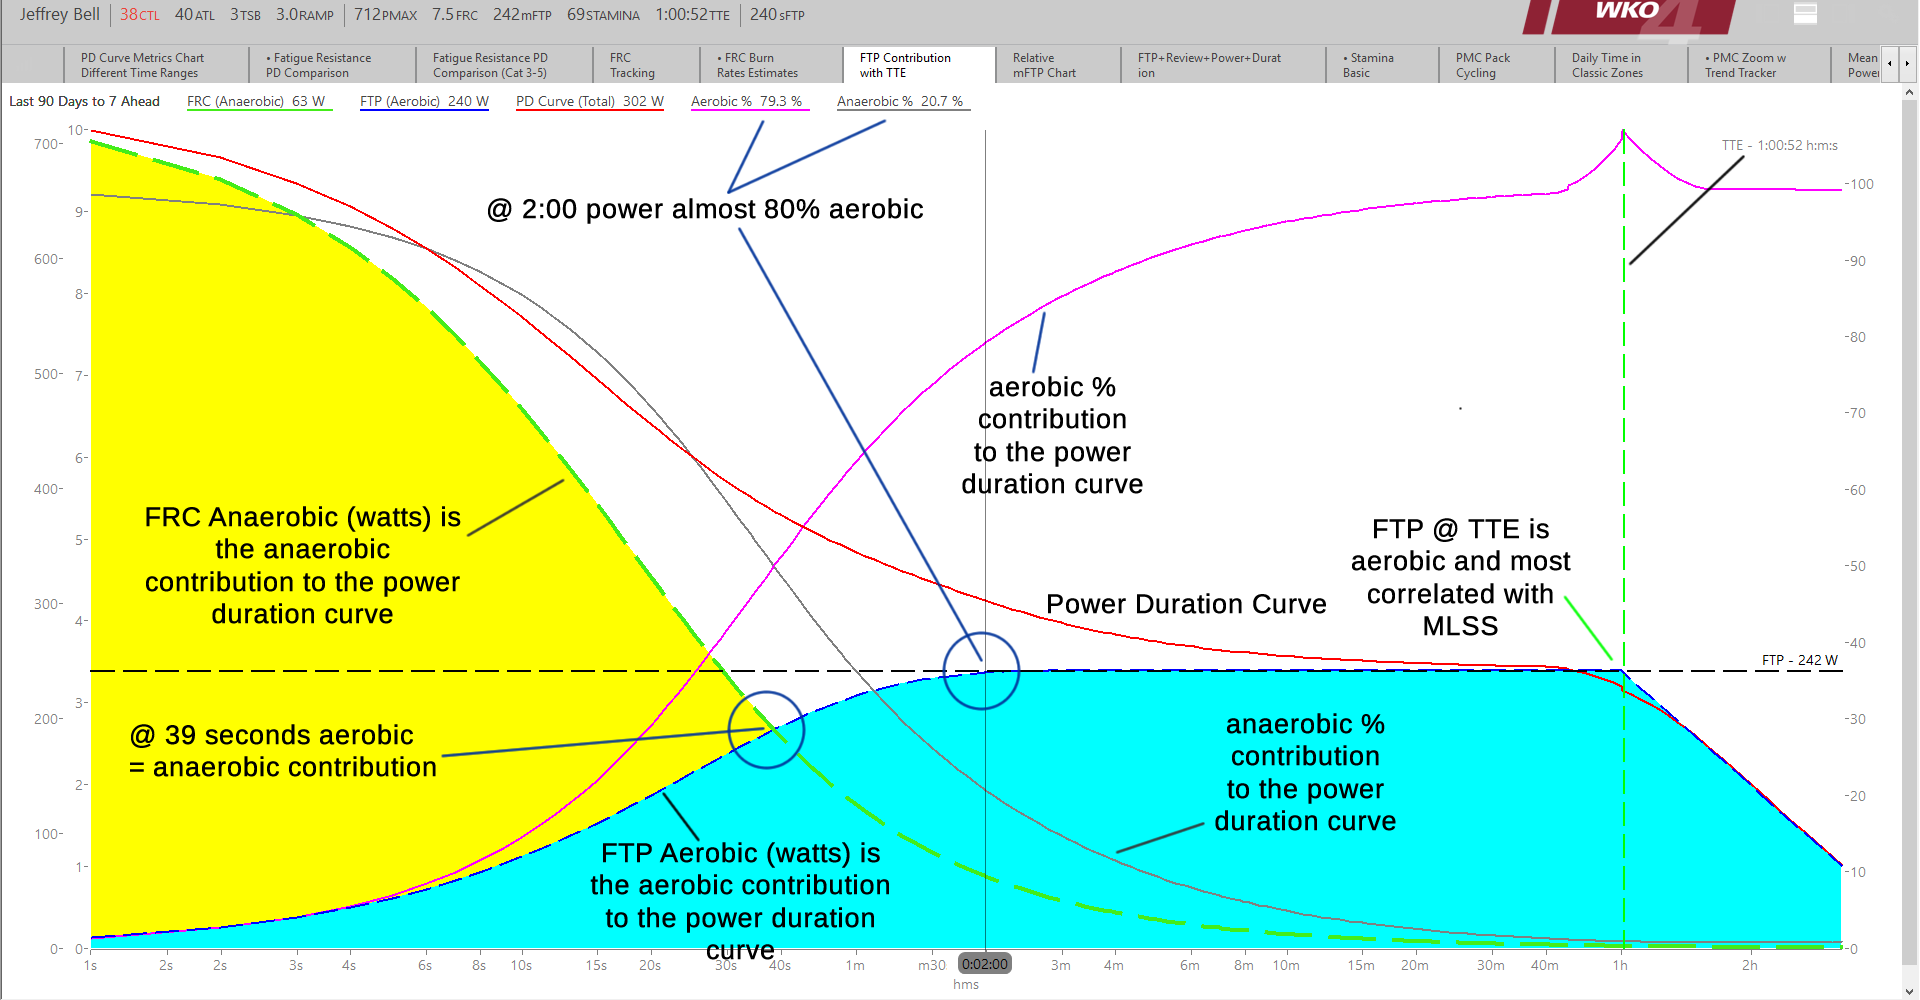
Figure 5: Aerobic and anaerobic contributions to the power curve and output over time.
This means the athlete has a larger anaerobic battery on which to draw energy when they have to do such efforts, such as breakaway from a pack or make a surge on a climb. They may also be able to produce a greater number of such efforts more often, as their AWC is replenished more rapidly after such efforts, with adequate training.
From both Figure 4, and Figure 5 above, it is obvious that cycling is predominantly an aerobic sport, as any effort longer than a minute has a rapidly increasing dominance of the aerobic system contributing more and more of the energy requirement, ultimately becoming the dominant energy benefactor.
Aerobic metabolism is extremely efficient at converting fuel to energy, being able to exploit carbohydrates, fats and protein for energy synthesis. It can produce greater than 34 ATP molecules from a molecule of these sources compared with the 2 ATP molecules created with anaerobic glycolysis alone.
However, as time duration extends the aerobic system energy needs to have the glucose stores in the body replenished. The aerobic system needs to be sustained from resources which will need to be taken in externally or derived from secondary fat stores and liver stores of glycogen.
The utilization of fat during aerobic metabolism, although slower, results in more than double the energy yield of carbohydrates. One gram of fat yields approximately 4 kilocalories of energy. A 75 kilogram rider with 15% body fat has 11.25 kilograms of stored fat, representing 101,250 Calories of energy potential. If the rider tried to use it all they would suffer some acute health affects and at worst die, but it is possible to access a huge proportion of this fuel store during cycling, providing the intensity is low enough.
When a rider’s aerobic system is better developed and adapted through training, the athlete will be able to ride at higher intensities whilst still using fat as the principal fuel. Consequently, the limited stores of carbohydrate are preserved for higher intensity efforts later in the ride.
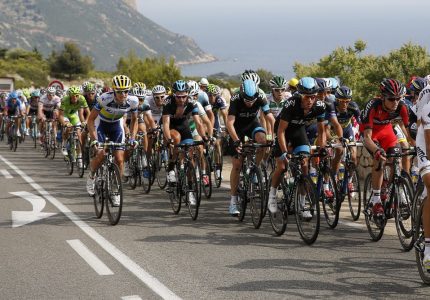
For example, in Stage 18 of the 2013 Tour de France, Jens Voigt escaped in a breakaway group. The route covered 172.5km. According to his power meter, he recorded a 309 watt average power for the duration of the stage, expending over 1000 Calories per hour for over 5 hours, much of which would have been supplied by fat metabolism. Consequently, he had reserves of carbohydrate available to fuel the higher intensity efforts on the stage, such as when he averaged 390 watts on the climb of the Col de Manse.
To understand the generation of power we need an energy expenditure measurement that ties the inputs from the cyclist to the resulting output of power and the bike moving forward.
Energy – KiloJoules and Calories
Energy in cycling refers to a couple things: the energy that is stored in the cyclists body in the form of chemical energy from nutrition, and the heat and mechanical energy that’s produced when we’re riding the bike.
Typically we think of energy expended during exercise expressed in food Calories. A Calorie or food energy (dietary) energy unit is in fact 1,000 calories (yes a small “c”). In fact the correct scientific expression for Calories is “kiloCalories”.
A calorie (small “c”) is a chemistry unit of measurement that approximates the amount of energy required to heat 1 gram of water by 1 degree Celsius. The Calorie (capital “C”) we are used to seeing represents the stored chemical energy from the food we consume. Energy that will be converted to heat and mechanical energy once the body is working.
So we have the following:
1 Calorie = 1,000 calories or 1 kcal
This is the reason we often see Calories expressed as kcals or kilocalories.
So the cyclist who looks at there bike computer or workout data and sees the calorie burned estimate of 800 Calories, that is 800 kilocalories. The 800 dietary Calories or 800,000 chemistry calories. For simplicity, the relationship is assumed, and we simply always refer to “calories” and do not have to be concerned about the scaling of the relationship or the capital C between dietary and scientific calories.
SI measurement of energy – Joules
The calories we are concerned with are the energy reserves stored in our food and bodies ready to be converted by the work done on the bike and that work is measured in joules. The power meter data we see, values reported in Strava, Training Peaks and cycling software as well as scientific instruments use the International System of Units (SI) – Joules. The Joule is the unit of work, energy and heat.
To convert joules to our utilized food energy Calories is simple:
1 calorie (small c) = 4.184 joules
We know the relationship between the scientific calories and the dietary Calorie.
We know 1,000 calories = 1 Calorie (dietary), and 1,000 joules = 1 kilojoule (kJ).
Therefore, 1 Calorie = 4.184 kJs.
The above relationship now has to account for human physiological efficiency referred to as Metabolic Efficiency and an adjustment of this energy conversion then has to be done. Unfortunately, 1 Calorie does not convert to 4.184 kJ of output when the human body and the muscles being used try to convert the fuel into work. Gross Metabolic Efficiency (GME) defines the success rate of conversion and the value typically ranges from 20% to 25% of the 1 Calorie burned. The remaining 75% to 80% of the stored chemical potential energy (Calories) is lost as heat energy to the environment.
So that now gets normalized to close to a 1:1 ratio as follows:
1 Calorie x 25% = 0.25 x 4.184 kJ = 1.045 kJ
This gives us our 1 kJ to 1 Calorie and defines the simple analysis of the kJ/Cal that is reported on devices and the relationship of work output to energy consumption for a human on a bicycle.
After a ride when your bike computer reads your power meter data and describes a 1200 kJ ride we can now derive the Calories it took the rider to produce the 1200 kJ.
First reduce the kJ power meter measure to the Calorie equivalent:
1200 / 4.184 = 286.81.
The GME of the cyclist at 25% is factored in:
286.81 / 0.25 = 1,147.24 Calories (kcals) to output 1200 kJ.
At 20% GME, which is probably closer to actual and what many studies have measured:
286.81 / 0.20 = 1, 434.05 Calories.
Therefore the burning of 1434.05 Calories was required to output 1200 kJ. Either way pizza or beer can be safely consumed after the ride.
In Part 2 of this feature on energy systems and cycling training with power, we will examine, in the context of training, the exploitation of the physiological systems defined and discussed above in Part 1.